The initial data for migration is usually files in various formats, such as: TXT(Text), XLS(Excel), CSV(Сomma Separated Value - separator is a comma, TAB (delimiter - tab character), Space-delimited, and Char-delimited (separator - space or a character), XML, LAS (geophysical data) and others. Seemingly waste majority of incoming file formats eventually turns out to a limited group of formats. DBRaptor is a powerful tool for creating and customizing templates for reading such files. The main advantage of the DBRaptor is an ability to extract and systematize information from source files that come in poorly structured or even in no-structured formats, e.g. plain texts.
It is not worth to go deep in this topic about traditional cross-tabular data in excel looking formats or XML files – they are structured by default. There is almost no challenge for standard database software to import from such files.
The most challenging aspect in the data migration process is isolating or identifying rows and columns in files. It might happen that even exported into .CSV format contain data with inconsistent columns and rows, due to redundant commas. As a result, many ETL tools are unable to process such files. Some packages offer brain cracking programming solutions, way above the competency of users with average computer skills. The inability these ETL tools to handle teh raw data leaves users needing to acquire expensive consultant services.
DBRaptor delivers a user-friendly approach to resolving data extraction issues. The user can easily “teach” the system how to extract data from files by creating extraction templates, and place it in an organized tabular structure. DBRaptor can also reuse extracting and transformation templates multiple times. What separates DBRaptor from other ETL applications is the simplicity and ease of usage of the interface – almost everything can be done with just a few clicks of a mouse.
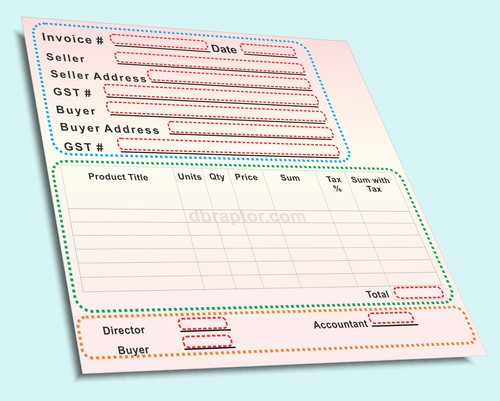
There are lots of standard excel invoice templates in the business world. The simplest way for a regular accounting clerk to generate an invoice is to fill the template with data, print, and save to file. Issues begin to arise when the need to analyse all separate invoices cums up. How do you extrapolate important information when the data sources come in hundreds or even thousands of files? Each file must be opened individually and examined. It is hard to rely on consistency (considering they all have the same format and layout) of file structure over time. Marketing analyst must spend anywhere from hours to weeks attempting to create a decent statistical report out of such mess.

Typical structure of the invoice template
Red dotted frames indicate areas of the information sources for separate field destinations. There is no secret in the world of data mapping. Each cell value must find its address in the destination table. Sounds simple indeed! However, looking closely at the data, one can identify a problem with this document: when time comes to read from central (green dotted) region, it is represented by a table. Previously we were “reading” from isolated cells row after row, now we have to deal with multiple columns in each row. Doing so would be simple if the template consists of strictly defined amount of rows in this table, but what if the table content is flexible and the director name resides not at the designated 16th row but somewhere way down in text file due to numerous entries in the table?!
There are files which do not have obvious separators or perhaps the position of data is defined by the column address. It is hard to rely on counting the amount of spaces because they are not controlling the structure of data.
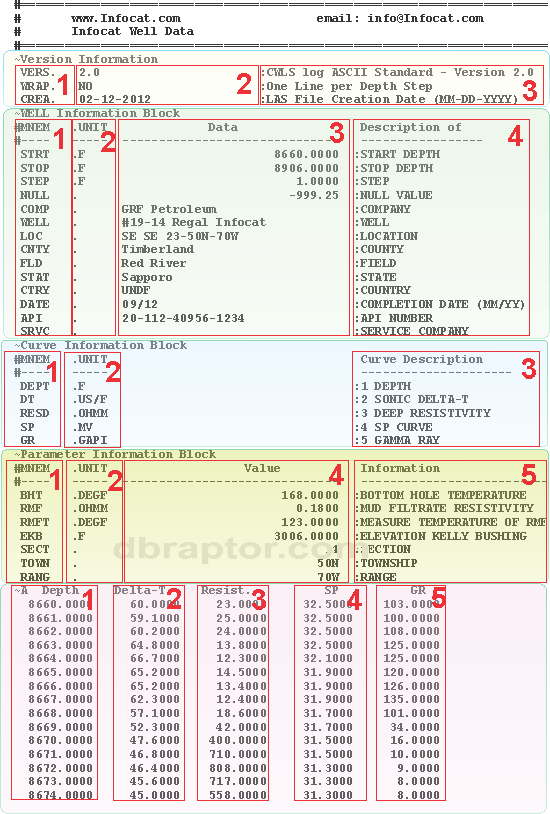
For example, LAS files – geophysical data results are recorded on a device and are retrievable only in such sophisticated format! Looking at the picture one can easily identify multiple areas and subareas within text document.
Traditionally data from such files can only be extracted by specially designed LAS file readers. Even for conventional LAS reader it is hard to transform the data into a relational database. This can create issues since the essential goal of collecting geophysical research data is having a relational database supporting prognosis and forecast reports for mining, coal, as well as oil and gas industries.
DBRaptor package is capable of not only reading such files but also converting them into relational databases. Thus, after a couple of hours importing couple of thousand LAS files, the oil gas consultant will have a ready-made powerful relational database filled with content that allows the user to conduct statistical analysis and produce reports. Instead of months, the reports can be created within a couple of days depending on the amount of raw source LAS files as well as data glitches, discrepancies, etc.

Typical structure of the LAS file
The most challenging documents for all ETL processors are PDF files containing customer questionnaire forms, application templates, etc. DBRaptor's powerful engine provides users simple deal with the .txt content of converted PDF files. DBRaptor can easily process either single file or multiple files as a bulk: just select a source folder with raw data files and push the button. The speed of transformation normally exceeds 600 files per minute.
If you still have questions please fill your request on the right and we will contact you soon.
Or you can apply for
support
